The root cause analysis (RCA) is a systematic problem-solving tool used to identify the root cause of any fault or problems. This is one of the seven basic Quality Control Tools which are graphical techniques used to troubleshoot issues related to quality. This method of finding root causes is also known as Fishbone Diagram and Cause-and-effect diagram. In this article, you will see the steps used for preparing a root cause analysis diagram and a few examples of applying this tool in quality control in the apparel manufacturing industry.
It is safe to say that a common challenge for any management team is to figure out the possible changes that can be done to improve any process or problem. Root cause analysis comes to an effective tool that can be used to solve such problems and perform any corrective and comprehensive system based review of any defects, irrespective of its criticality. It does so by focusing on pinpointing the root cause of the specific defects and its contributing causes. After that these factors are represented in a pictorial representation wherein all the factors are sorted according to their groups which lead to the effect. This makes visualization much easy for analysis of the problem.
Steps for doing root cause analysis
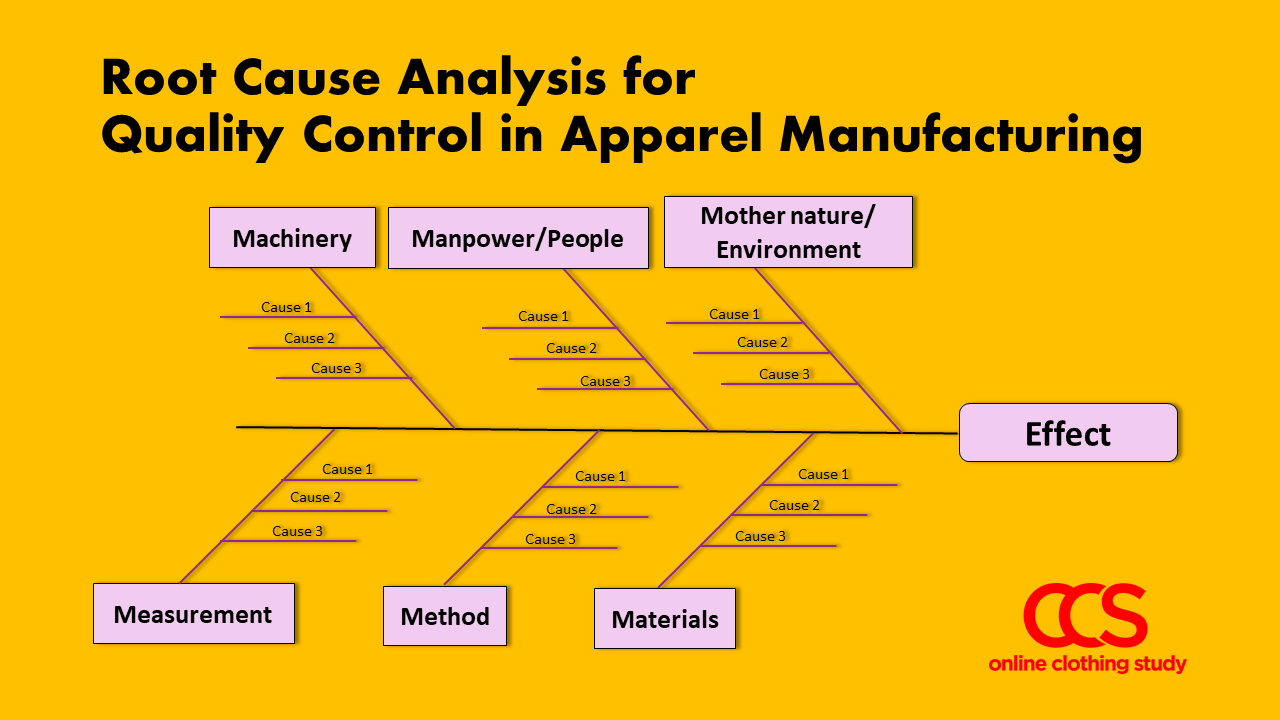
The following are the steps in which an effective Root Cause Analysis chart can be made
Step-1: The first step to creating the diagram is to write the Effect on the right side in a box. You can write a problem you faced in your production processes or identify a quality problem and write it in the box.
Step-2: Following this effect box, a horizontal line has to be drawn from the effect to its left.
Step-3: After this think of all the categories of factors that are leading to the effect. These categories should be such that the visualization of the diagram will be easy. One such set of effective categories consists of the 6M’s which are Machinery, Manpower/People, Mother nature/Environment, Method, Materials, and measurement. The process of categorizing the potential causes can be very useful to breakdown the complex problems and focus on various perspectives.
Step-4: After looking at the categories the causes have to be identified and arranged. This can be done through the proper technical investigation of the process, asking people close to the process, etc. to reach a useful level of detail.

Fig-1: Root Cause Analysis Diagram

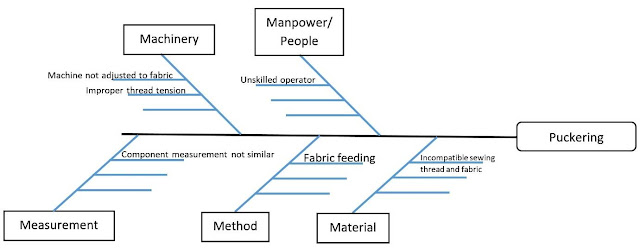
Fig-2: Diagram for root cause analysis for defect -Puckering

Fig-3: Diagram for root cause analysis for defect: missing label

Fig-4: Diagram for root cause analysis for defect: Oil stains, dirt spot, a rust spot

Fig-5: Diagram for root cause analysis for defect- Broken Stitch

Fig-1: Root Cause Analysis Diagram
Root Cause Analysis for Quality Control in the Apparel Industry
The quality of any apparel is depended a lot on the absence of any defects. And this can be made possible and consistent only if the quality in the manufacturing is kept at a strict control. Defects in apparel can arise from cutting, sewing, finishing etc. only to name a few and the key job of any quality management team is to figure out the key source/cause of such defect to rectify it. And Root Cause Analysis comes a great way to identify those defects and work on them.The following are some basic examples of defects of which the root causes have been found out through this method.
1. Finding the root cause of seam puckering
Seam puckering in one of the common problems found in the garment seam. The appearance of puckering in a garment is not desirable. So, to eliminate the generating puckering in a seam, you can do root cause analysis with your team and prepare this diagram. If the possible causes are listed down in the cause-and-effect diagram, we will find the following.Puckering can be generated due to - incompatible sewing thread and fabric, fabric feeding in a sewing machine, unskilled sewing operator, components that are sewn together may not be equal in measurement. The cause might be machine set-up - the machine is not adjusted to fabric or thread tension is not set-up correctly.
Fig-2: Diagram for root cause analysis for defect -Puckering
2. Finding the root cause for the missing label in a garment
The possible causes for 'label missing' in a finished garment can be one of the following.Fig-3: Diagram for root cause analysis for defect: missing label
3. Finding the root cause of stains in a garment
The possible causes for 'stains' in a garment can be one of the following. You need to study all the possible reasons and verify the causes. This diagram will help you find the root cause in a systematic way. After finding the root cause, you can prepare a plan on how to avoid such stains in the garment. A related post - how to avoid oil staining in garments in manufacturing stages?
Fig-4: Diagram for root cause analysis for defect: Oil stains, dirt spot, a rust spot
4. Finding the root cause for broken stitch
Broken stitches are commonly found in a garment seam. You know any broken stitch in a garment is a critical defect. To reduce the frequency of such defect generation, you can do the root cause analysis. Here we have shared the possible reasons for broken stitches in garments shown in four categories. You need to narrow down the reasons after analyzing each possibility.Fig-5: Diagram for root cause analysis for defect- Broken Stitch
Related post: The 5 WHY – A Simple Process to Understand Any Problem
Conclusion
The above are only a few examples of defects. After the causes are identified these need to be handed over to the responsible person for corrective action and execution. The beautiful feature of this chart is that once the format is set at destined places such as in-line, end-line inspection the causes and effect can be made dynamic and changed depending on defects and style change.
