You make the daily production report (DPR) every day. Factory managers and top management read your daily production report every day. This report gives you the performance data for the last product date. In this post, I will share templates for the weekly production report.
With a single day’s production data and performance data, there is not much scope for getting the real performance of the line and machine operators. On some days the floor and production line may have reduced production volume due to one of many issues.
You must review the production and performance trends for a period to understand the floor performance better. Data analysis is only possible when you see more than one day's production at a time. By preparing the weekly production report, you can improve weekly data analysis.
Include data analysis activity in your daily task after report making.
Data analysis for a short period can be done for a week (calendar week). A weekly production trend can be prepared from Monday to Saturday.
How to do that?
Here, I will be referring to the weekly production report using an Excel spreadsheet. Make weekly production report in a single worksheet. Use an optimized template for weekly production reports. You might be already making DPR on daily basis. This is perfect for reporting daily line performance. But don’t try to analyze 6 days of production data using 6 different Excel files or 6 printed reports of 6 DPR.
See the below templates with dummy data. You can include these weekly report templates in your MIS reports.

In the report header, you must mention the Week Number and Year. Mention the week starting date and week ending date.
In the table grid, add the following headers
Use the below template (Image-2).
 Image 2: A template of a weekly report by the operator
If you have software for data tracking and you used to save daily production by date in the database (like SQL), you can design a similar weekly report and fetch the production data from the database. I have seen factories make this kind of report from SQL database and data is fetched to Excel using ODBC.
With a single day’s production data and performance data, there is not much scope for getting the real performance of the line and machine operators. On some days the floor and production line may have reduced production volume due to one of many issues.
You must review the production and performance trends for a period to understand the floor performance better. Data analysis is only possible when you see more than one day's production at a time. By preparing the weekly production report, you can improve weekly data analysis.
Include data analysis activity in your daily task after report making.
Data analysis for a short period can be done for a week (calendar week). A weekly production trend can be prepared from Monday to Saturday.
How to do that?
Here, I will be referring to the weekly production report using an Excel spreadsheet. Make weekly production report in a single worksheet. Use an optimized template for weekly production reports. You might be already making DPR on daily basis. This is perfect for reporting daily line performance. But don’t try to analyze 6 days of production data using 6 different Excel files or 6 printed reports of 6 DPR.
Weekly production reports:
A weekly production report can be made in the following ways.- You can make a weekly report for line output data
- You can make weekly production reports by sewing operations
- You can prepare a weekly report for each sewing operator
See the below templates with dummy data. You can include these weekly report templates in your MIS reports.
How to make Weekly Production Reports (like these):
It depends on how you are recording and maintaining your daily production data currently. How detailed you are capturing production. If you collect machine operator-wise and sewing operation-wise (individual operation) production data, then you can make all these reports that are shown in the above list.#1. Line-wise weekly production report
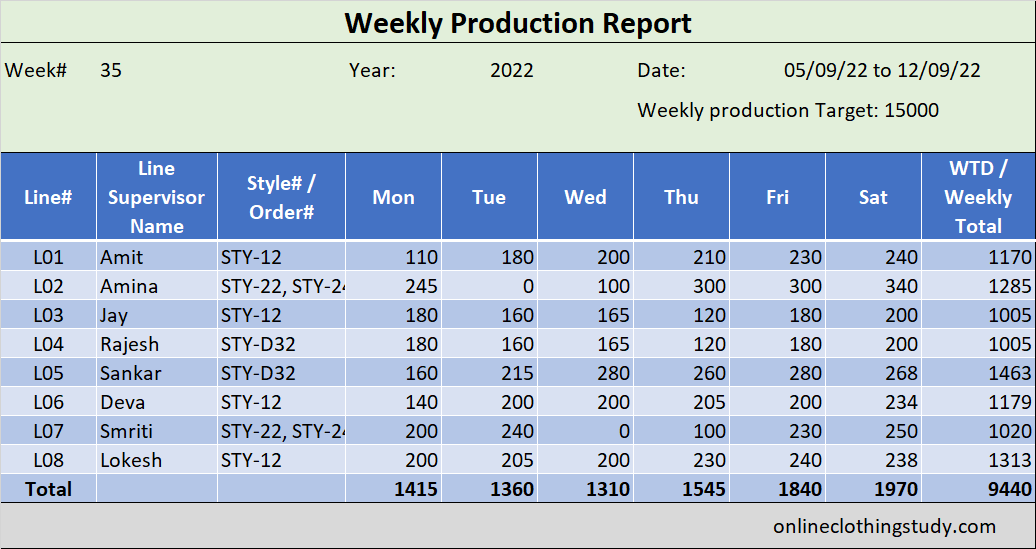
In this report, an engineer uses the line output data for daily line production. Make one worksheet showing 6 days of production (considering one day weekly off). If your factory works on Sunday (a weekend), you can keep 7 days in the weekly production report. See the bellow template (Image-1).
Image 1: This is a sample report for representation.
In the report header, you must mention the Week Number and Year. Mention the week starting date and week ending date.
In the table grid, add the following headers
- Line Number
- Style number (Single or multiple style names)
- Line supervisor name (optional)
- 7 columns with day name (Mon, Tue, Wed, Thu, Fri, Sat, Sun)
- Add weekly total production column.
#2. Weekly production report by the operator
To make a weekly production summary by the sewing operator, you need to capture the operator's daily production from the production line. If operator-wise daily production data is available, you can develop the Weekly production report by the operator.Use the below template (Image-2).

#3. Weekly production report by operation number
To make a weekly production summary by the operations, you need to capture daily production by operation number from the production line. If the operator and operation-wise daily production data are available, you can develop the Weekly production report by operations.If you have software for data tracking and you used to save daily production by date in the database (like SQL), you can design a similar weekly report and fetch the production data from the database. I have seen factories make this kind of report from SQL database and data is fetched to Excel using ODBC.
Like the weekly production reports, you can also make a weekly efficiency report in a similar template.
