

How do you check the production status of a line?
All these methods are age-old. Display your reports and dashboard on the LCD screen. This is an effective way to monitor shop floor production. Secondly production status will be visible to everyone who is working on the floor.
- How many pieces are made by the line at this moment since morning?
- What are the operations wise production?
- At least production update of critical operation in the line?
You will say it is not possible to track the production of every minute. Checking hourly report or looking into it every half an hour is not possible.
If you have the technology to capture real-time production then, I suggest you add display board (digital) in the sewing floor. Our clients are using an LCD screen to display real-time data on the floor.
Production Quantity and Target Quantity Display
This is a very simple one. They display line output quantity only. Other things like target production report are entered into the system. The balance quantity to be produced by the line in balance time and line efficiency at this moment is calculated by the system. See the following screen.
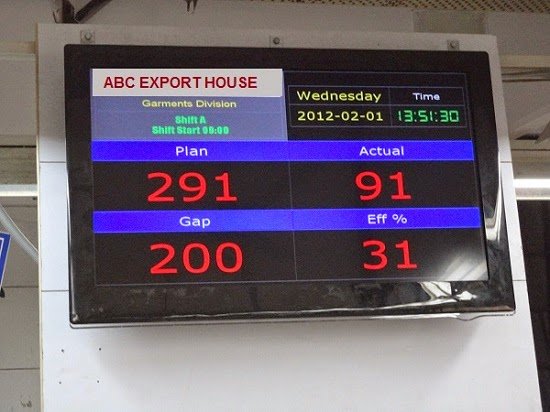 |
| Screen 1: Displaying Production and Efficiency of the Line |
Line Efficiency Display
Efficiency data can be shown in speedometer or in digits. If you have multiple sewing line in one floor and you like to display data in one display board you can do that. See the screen no 2, the factory is displaying efficiency data for 3 lines.
Display Production Quantity of critical operations
This screen will give you production of data of the specific operations. It tells WIP level on those specific workstations.
Displaying the production quantity of critical operations of a line will help to see a balancing of the line. If there are pick and valley in the bar chart, you know that there is a balancing issue in the line. See graphs on screen 2.
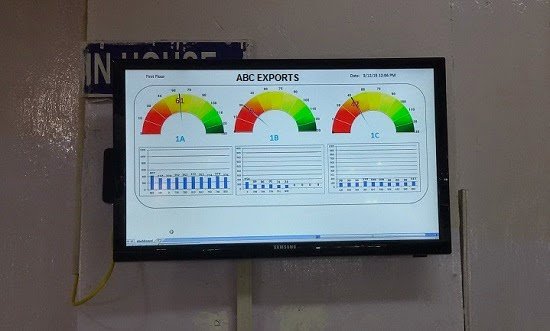 |
| Screen-2: Efficiency of multiple lines and Production data for specific operations line wise |
Display Quality Performance
You are checking stitched pieces at the end-of-line. You prepare quality reports on defects founds and frequency of defects. You do analysis stitching quality in the form of DHU (defects per 100 units) of checked pieces. If you don’t share quality performance of the line your reports have no use.
Display DHU and Pareto Chart of defects on the screen.
Consider displaying data on screens and place the screen on the shop floor. Make good reports using graph and charts. As data can’t be visible from a distance but a chart can be.
Do you find this information helpful?






Leave a Reply